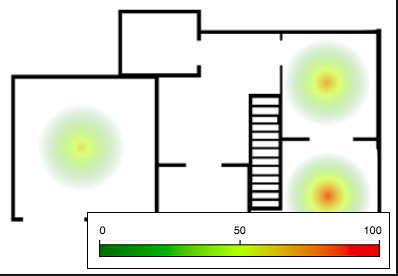
A heat map positions color-coded circular elements at specified locations on an image, for example, to visualize temperature by room, as shown in the following figure.
In a heat map, the data value used for color coding is called the "intensity" value. The basic steps to create a heat map are as follows:
To configure the size of the elements, set the Radius property. To configure how the gradient is apportioned, set the Falloff property.
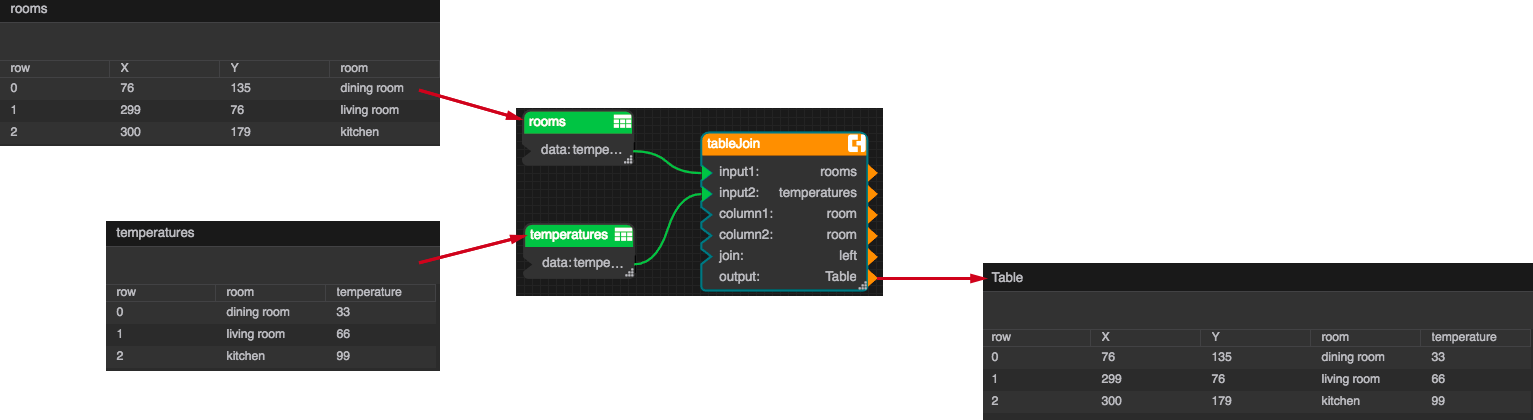
If you are using a heat map with a real-time data feed, define two tables in your dataflow: a static table that specifies the locations where you want to render elements, and a table that receives the intensity values. Join them into a single result table that you can bind to the heat map. The following figure shows a simple example of this approach, using room name as the identifying column for the join.
Return to Atrius Developer Portal Home Page